May 2019 – OPDEC is experienced in automating the task of updating reoccurring presentations. The complexity depends on the amount of individual nuances built into the presentations. In this article, we’ll be discussing a generalized version of the Chart Package Tool; it is highly customizable.
This tool helps clients who must generate PowerPoint presentations on a regular basis. If the data feeding these presentations is in a standardized format, OPDEC can automate their generation. The tool imports cost data and any other associated data that needs to be included (manager notes, variance narratives, etc.), creates Excel based charts to visualize it, and then creates a PowerPoint presentation using those charts. This tool is particularly helpful for situations requiring cost data trends to be regularly reported and analyzed. What used to take one employee a week to create can be achieved through a few minutes and button clicks.
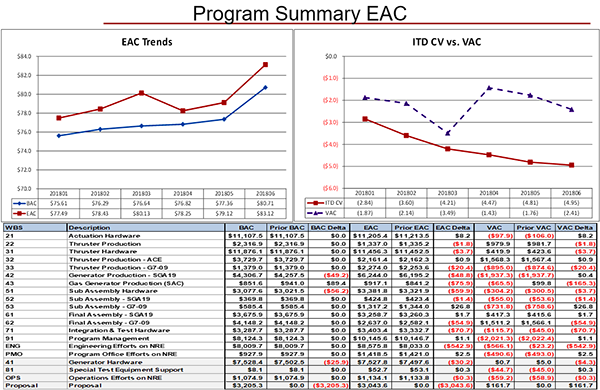
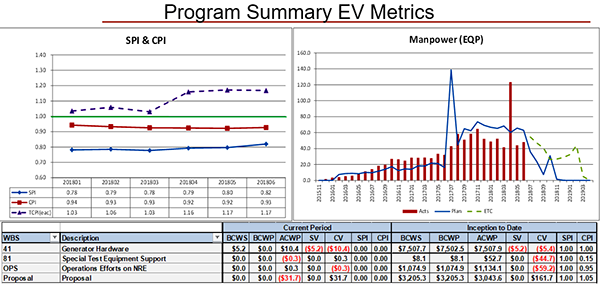
In this iteration of the tool, the resulting PowerPoint presentation is approximately 50 slides all generated from scratch within five minutes. The images below offer a preview of the grand summary slide of the final result.